No ROI evidence
No proof of ROI no budgetWe make the channel measurable
When influencer marketing barely features in your reports, it loses every internal budget discussion. IDA breaks each placement down into CAC, ROI and CLV, right down to the creator.











Losing the budget discussionBecause the numbers are missing
Standard reports track Meta and Google to the cent. Creators barely show up.
- 01
Last-click misses creators
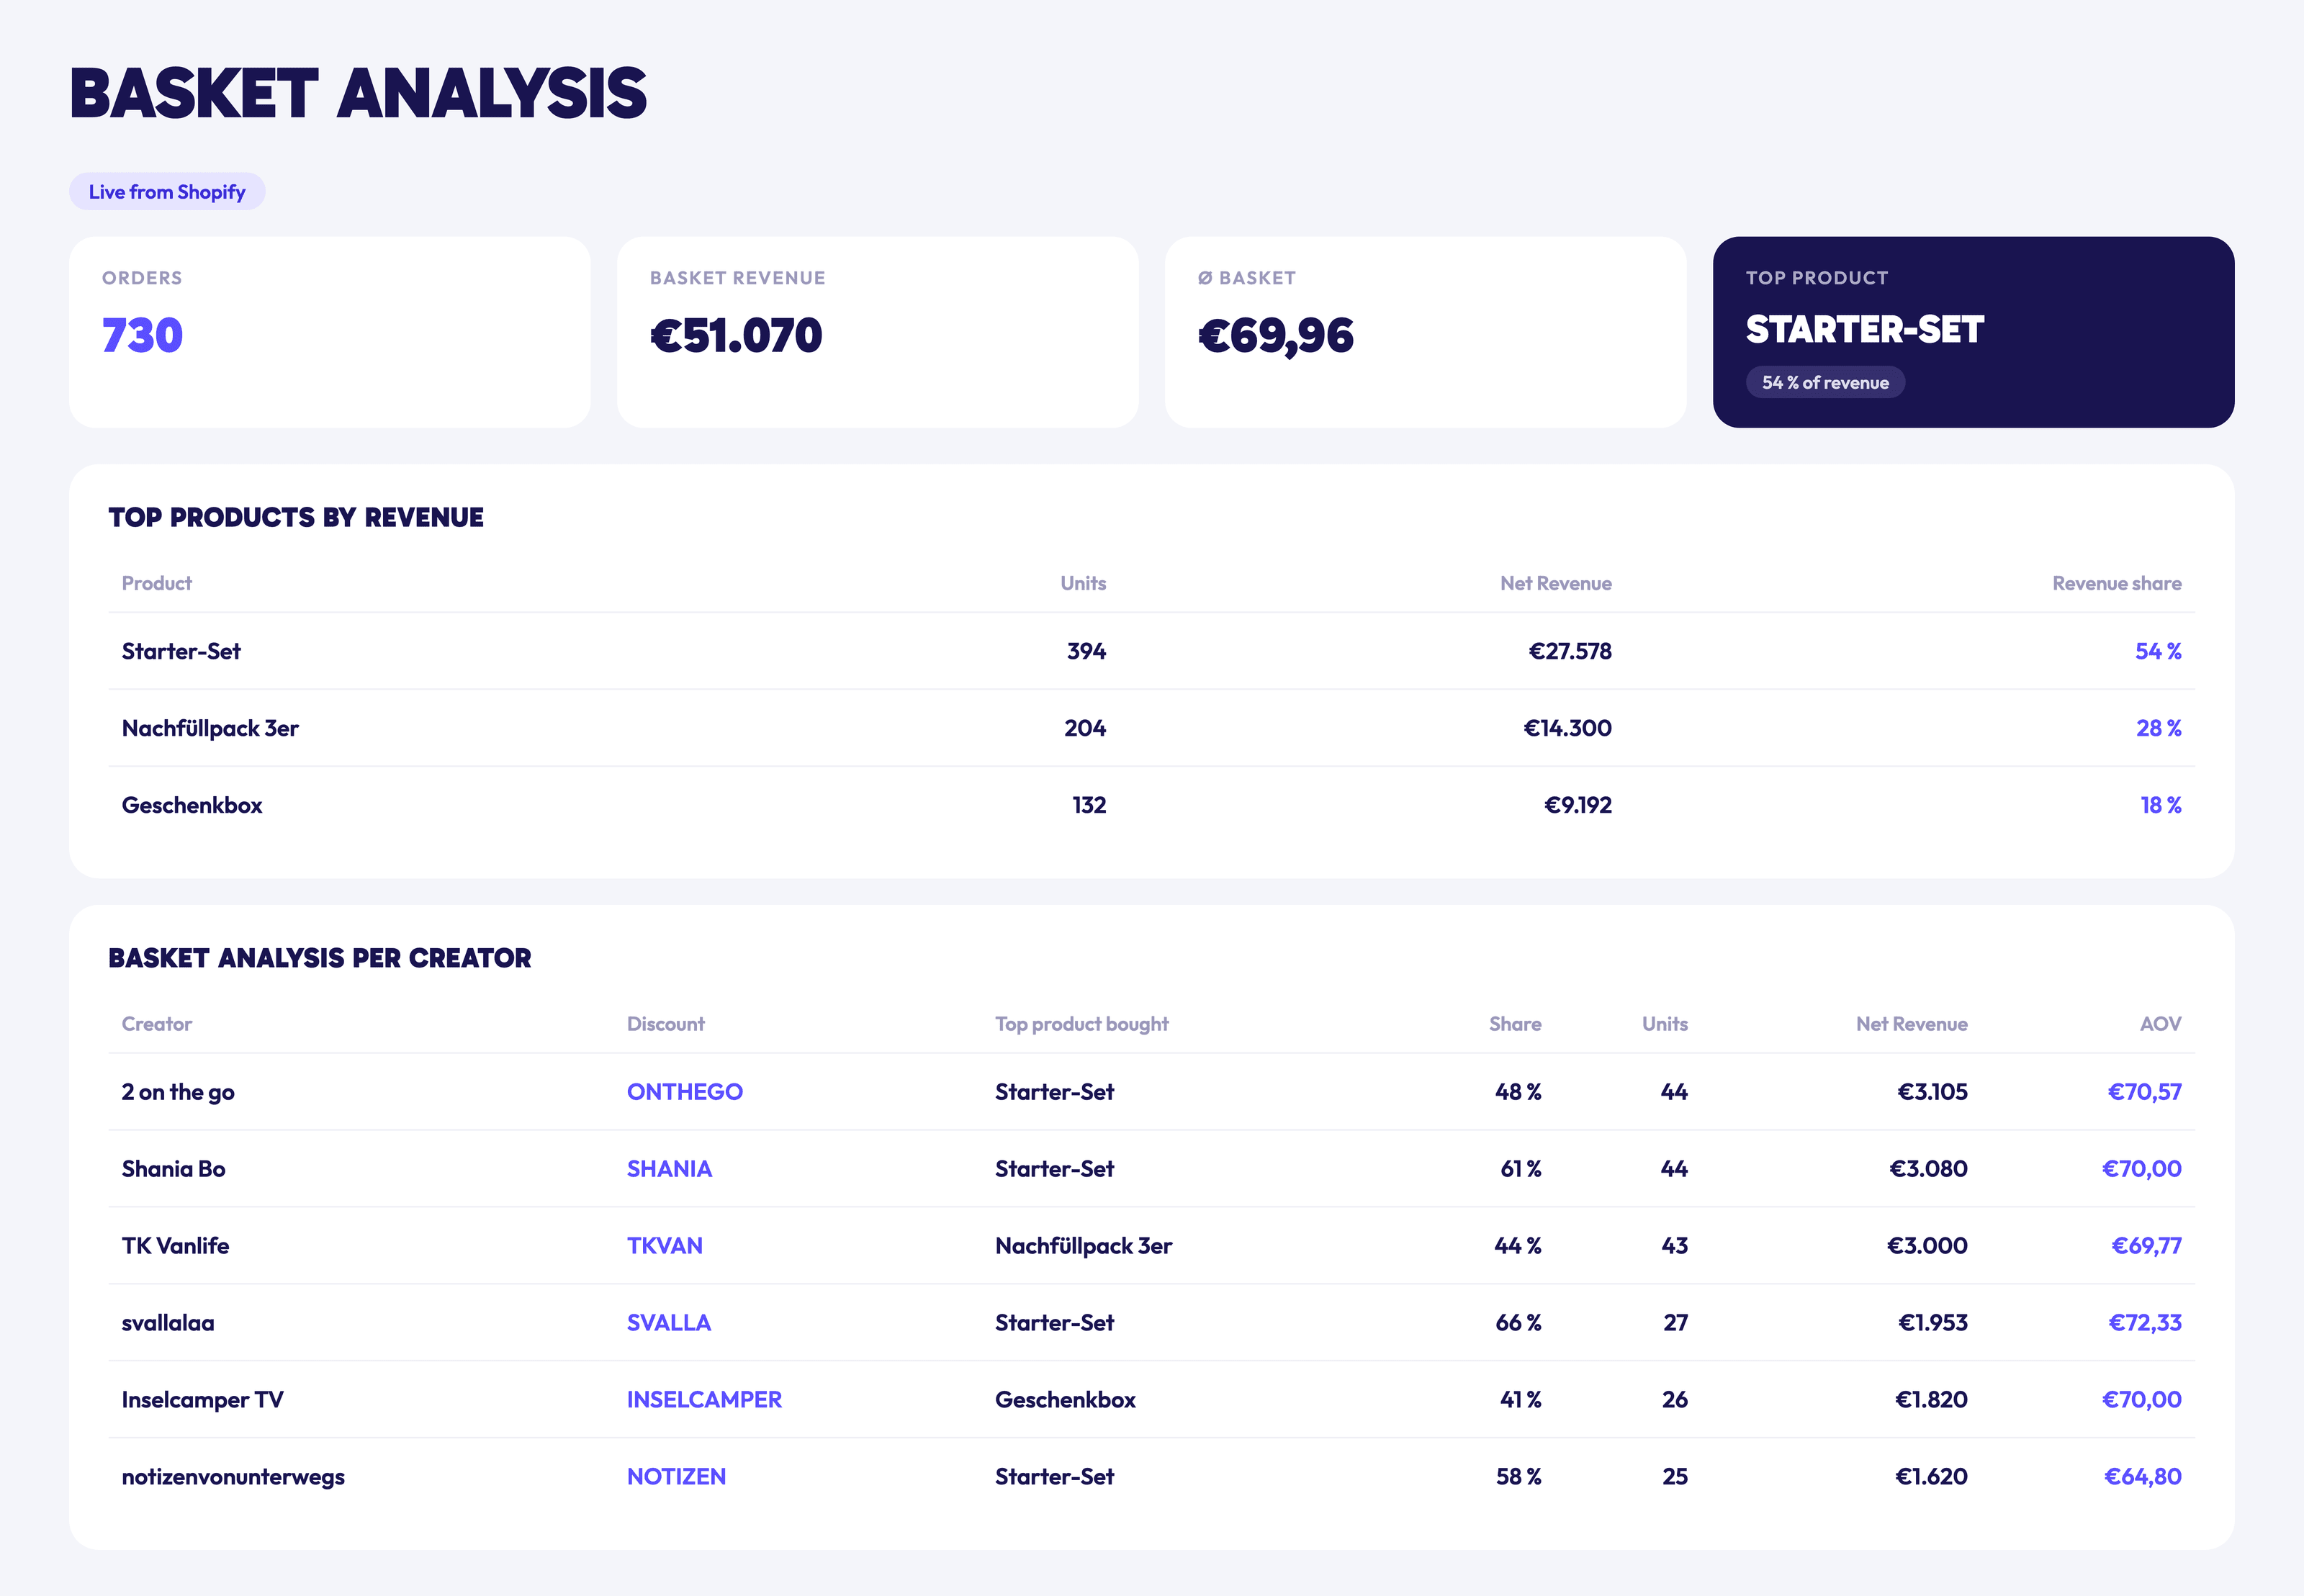
Someone watches a video and orders days later. Last-click attribution rarely credits the creator. IDA combines discount codes, UTM links and store data to show revenue and CAC per creator.
- 02
Spend without the full picture
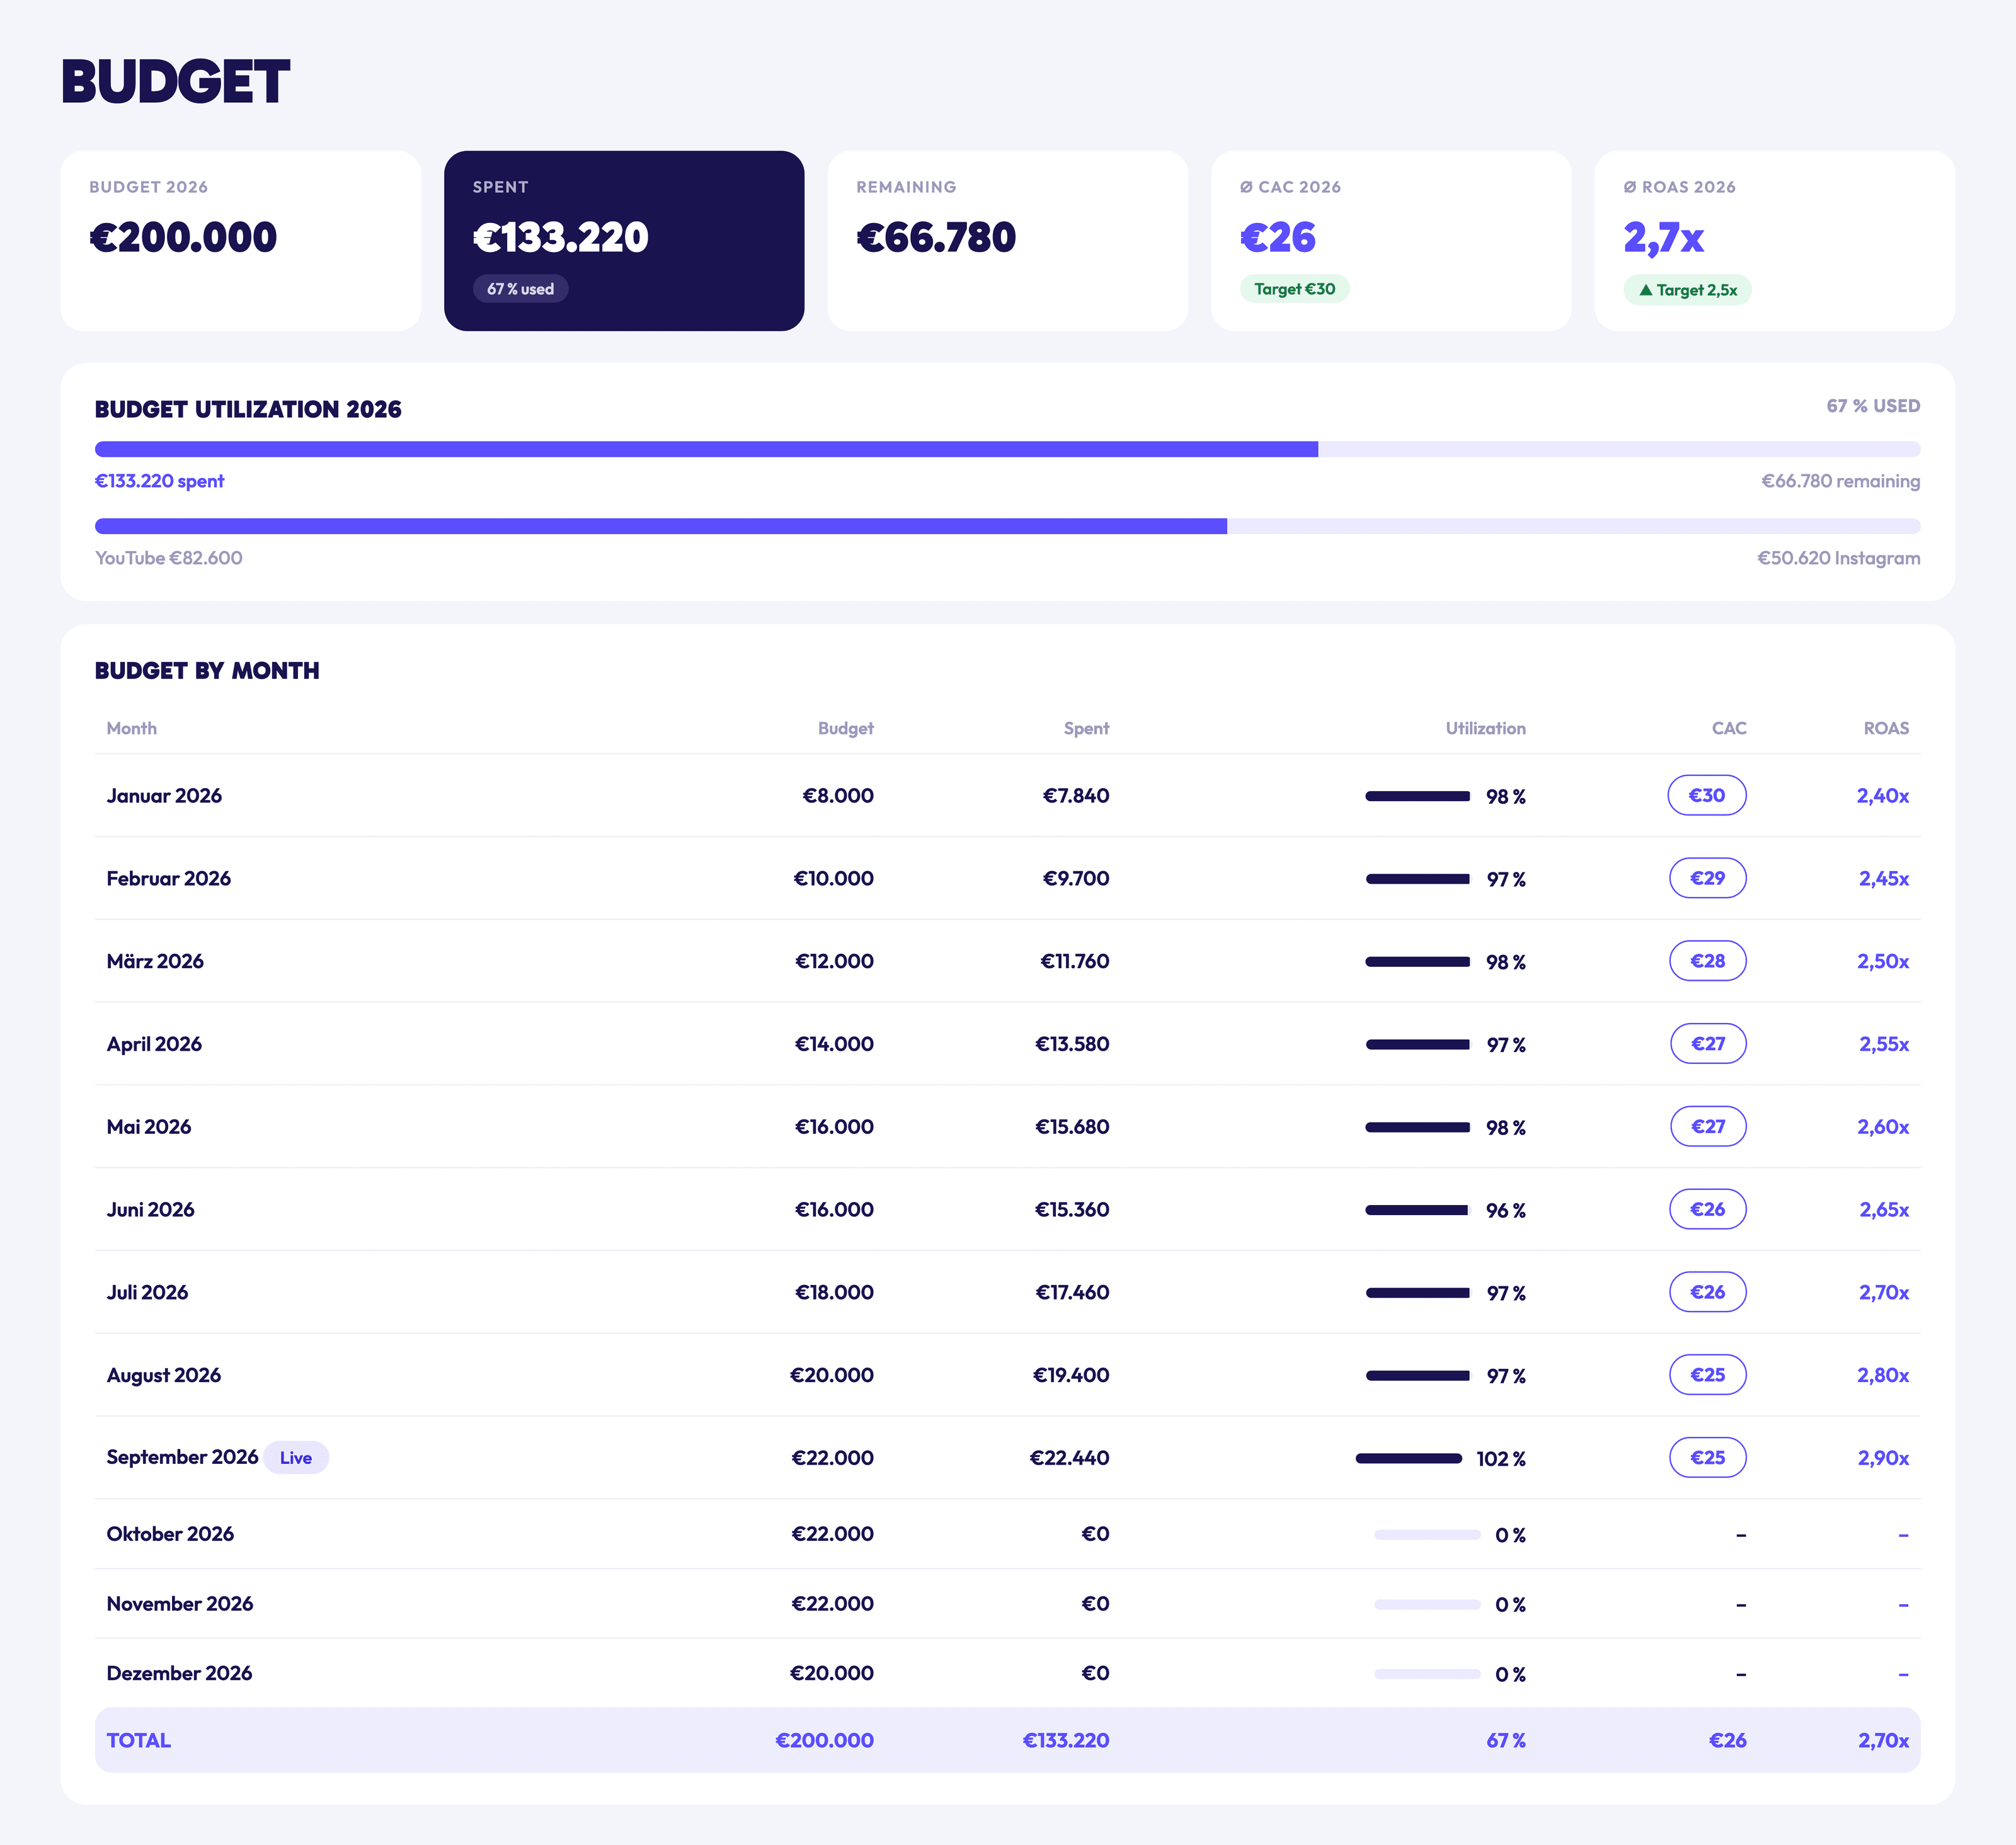
Money goes out every month, but results rarely get the same attention. IDA puts planned, spent and remaining budget alongside CAC and ROAS, measured against your targets.
- 03
Scepticism without evidence to challenge it
Without reliable numbers, influencer marketing remains the channel that supposedly won't scale. IDA compares spend, new-customer costs and ROAS against your targets every month.
Reach doesn't prove ROIRevenue per creator does
Here's how influencer marketing is usually measured, and how we measure it. The difference determines whether the channel earns more budget internally.
Typical measurement
Success defined by reach, engagement and delivered content
Discount codes and links maintained in a spreadsheet
A channel average that mixes strong and weak creators
A monthly report showing one snapshot in time
Coupon-site codes distort results unnoticed
Data isolated from the store and analytics
Measurement with IDA
Revenue per creator, CAC and marketing efficiency ratio
A code and UTM link per creator, synced with your store
Every placement individually, with costs, conversions and revenue
Daily figures that reveal delayed conversions
Codes appearing on coupon sites stand out
Connected to Shopify, KLAR and Google Analytics
Make it measurableThen allocate budget
Tracking is built into every phase, from the potential analysis to scaling.
Growth potential assessment
Before booking a creator, we define success: your CAC and ROAS targets and average order value. We then match your data against over 20,000 campaigns to identify suitable verticals and audiences.
In parallel, we connect IDA to your store. Shopify supplies daily orders, discount codes and basket data; we connect KLAR and Google Analytics too. Measurement is ready before testing begins.
Testing
Every creator gets a unique discount code and UTM link, synced with your store. Orders can be assigned to the relevant placement, and we can spot codes appearing on coupon sites and distorting results.
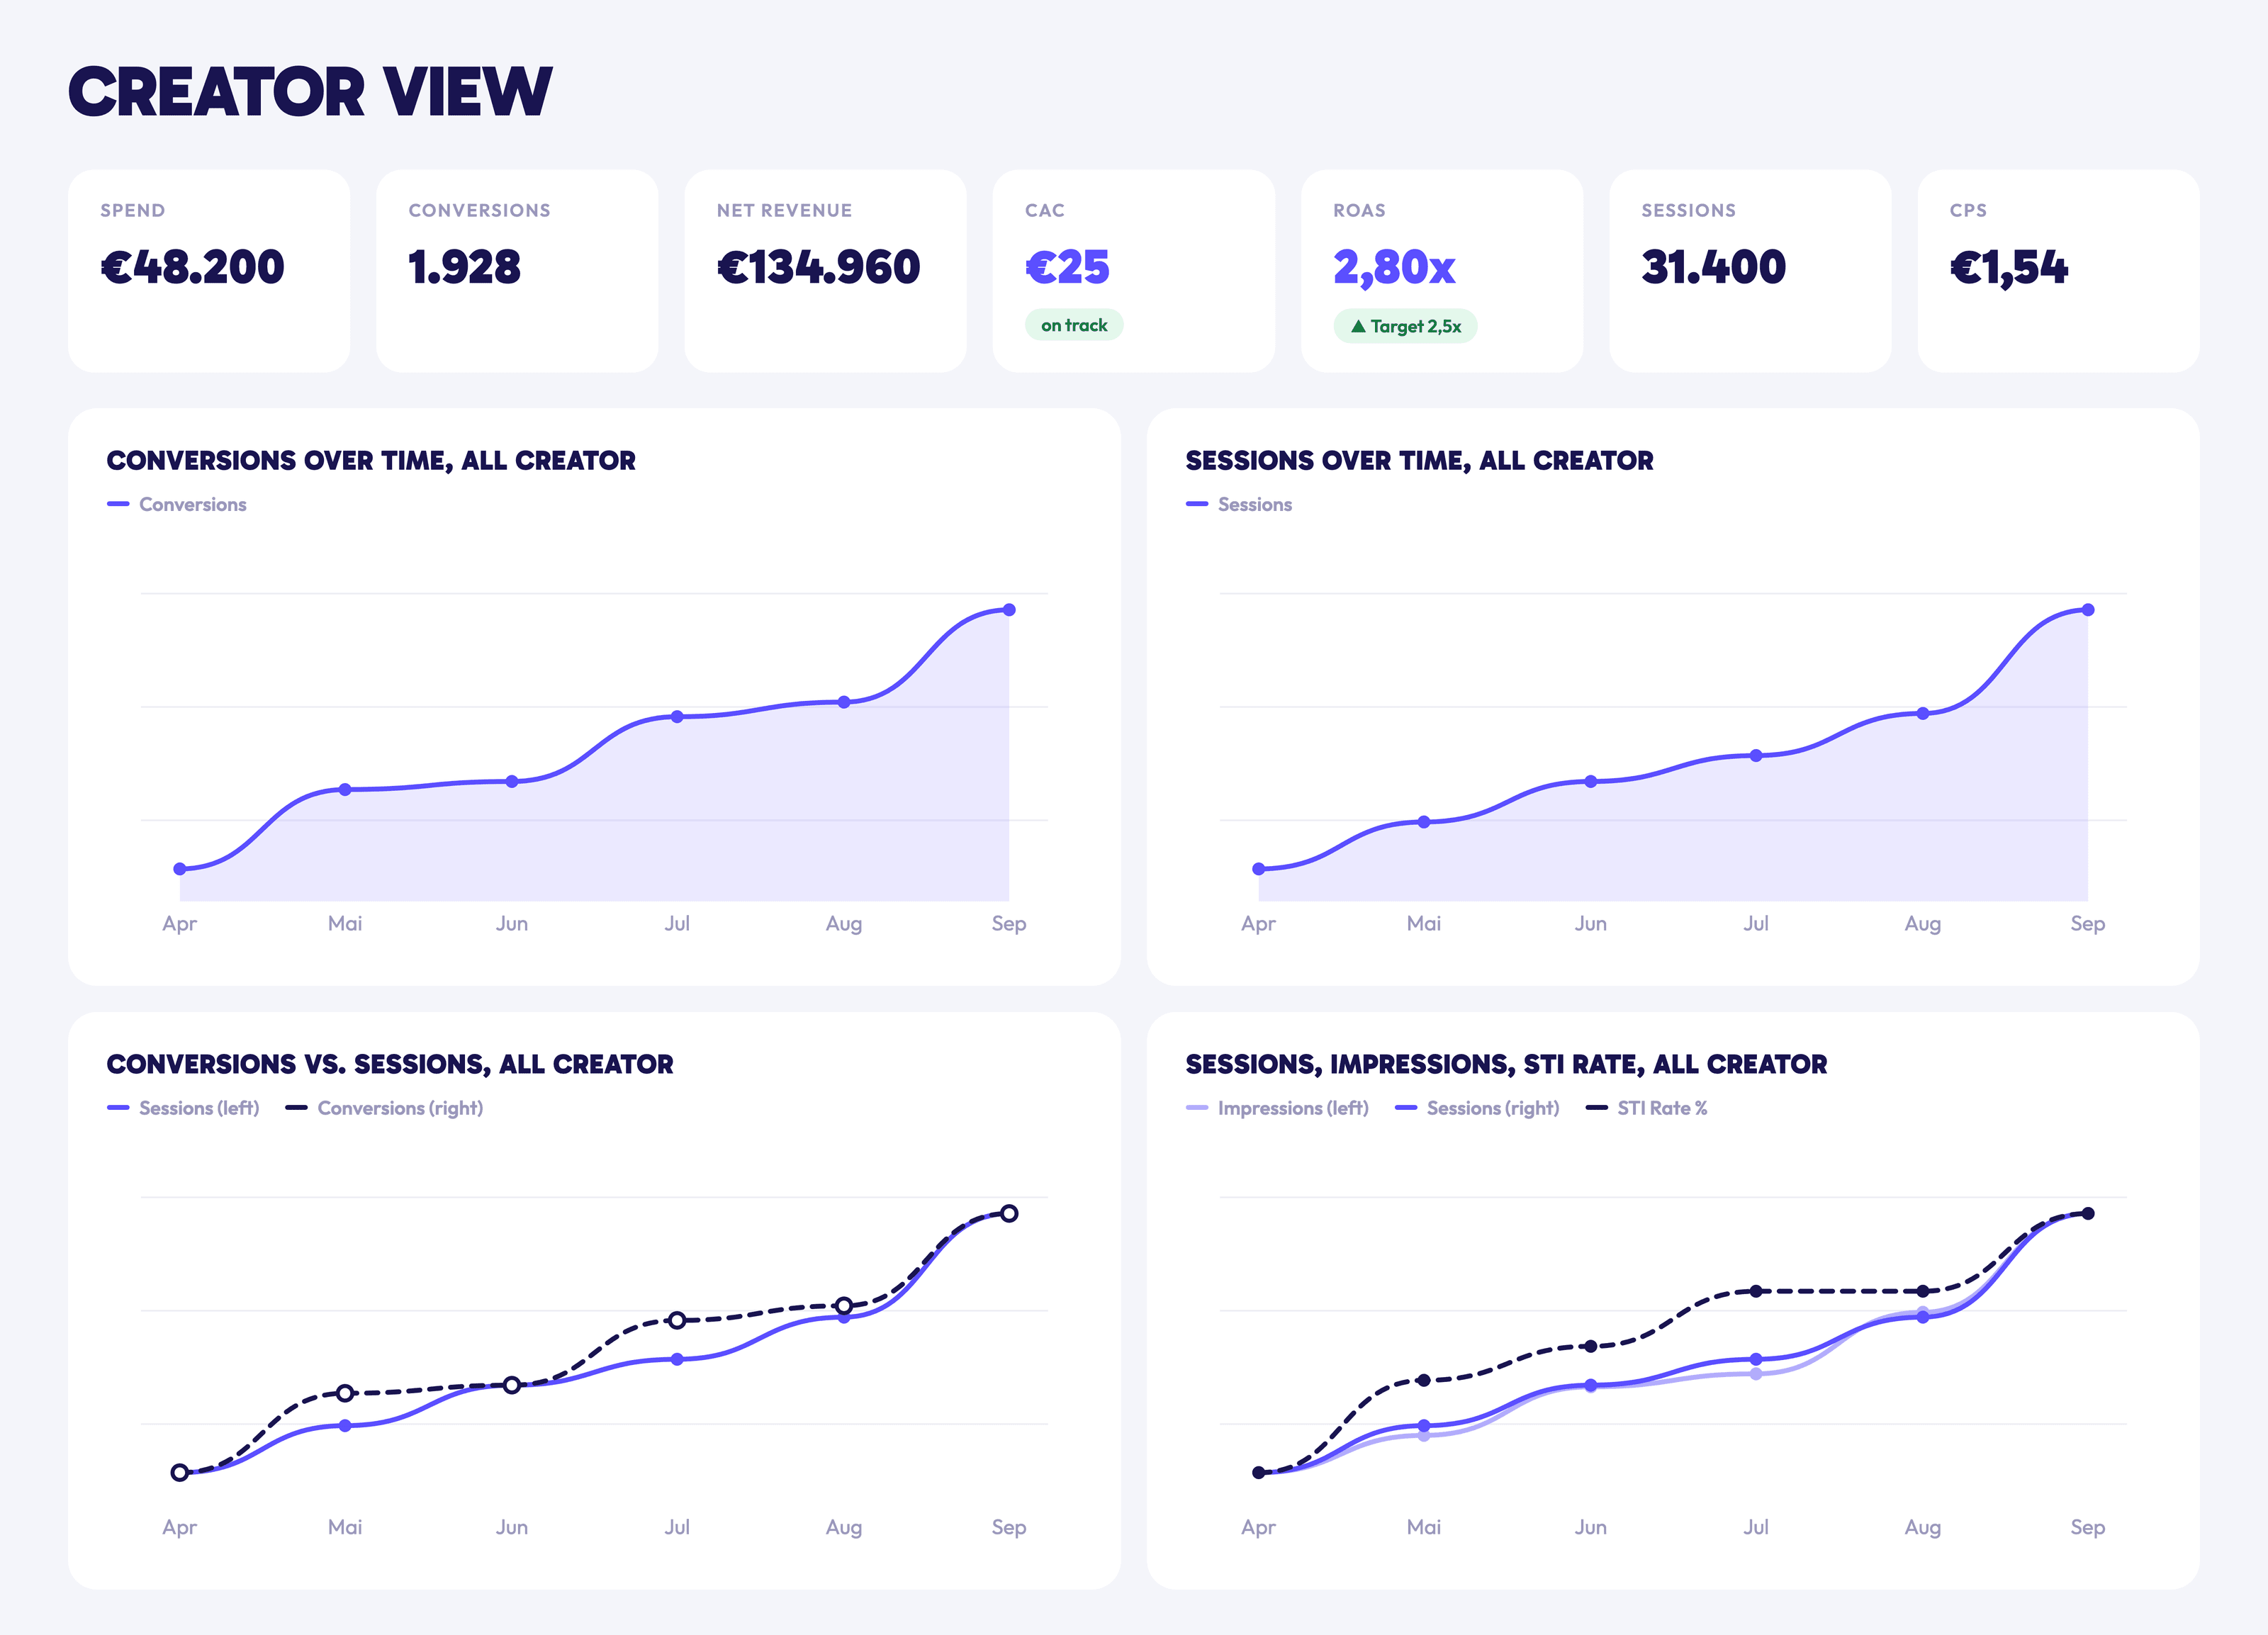
Codes do not capture everything—for example, when customers buy a different product. We assess daily performance and delayed conversions for each placement, using an attribution model that includes repeat purchases where needed.
Scaling
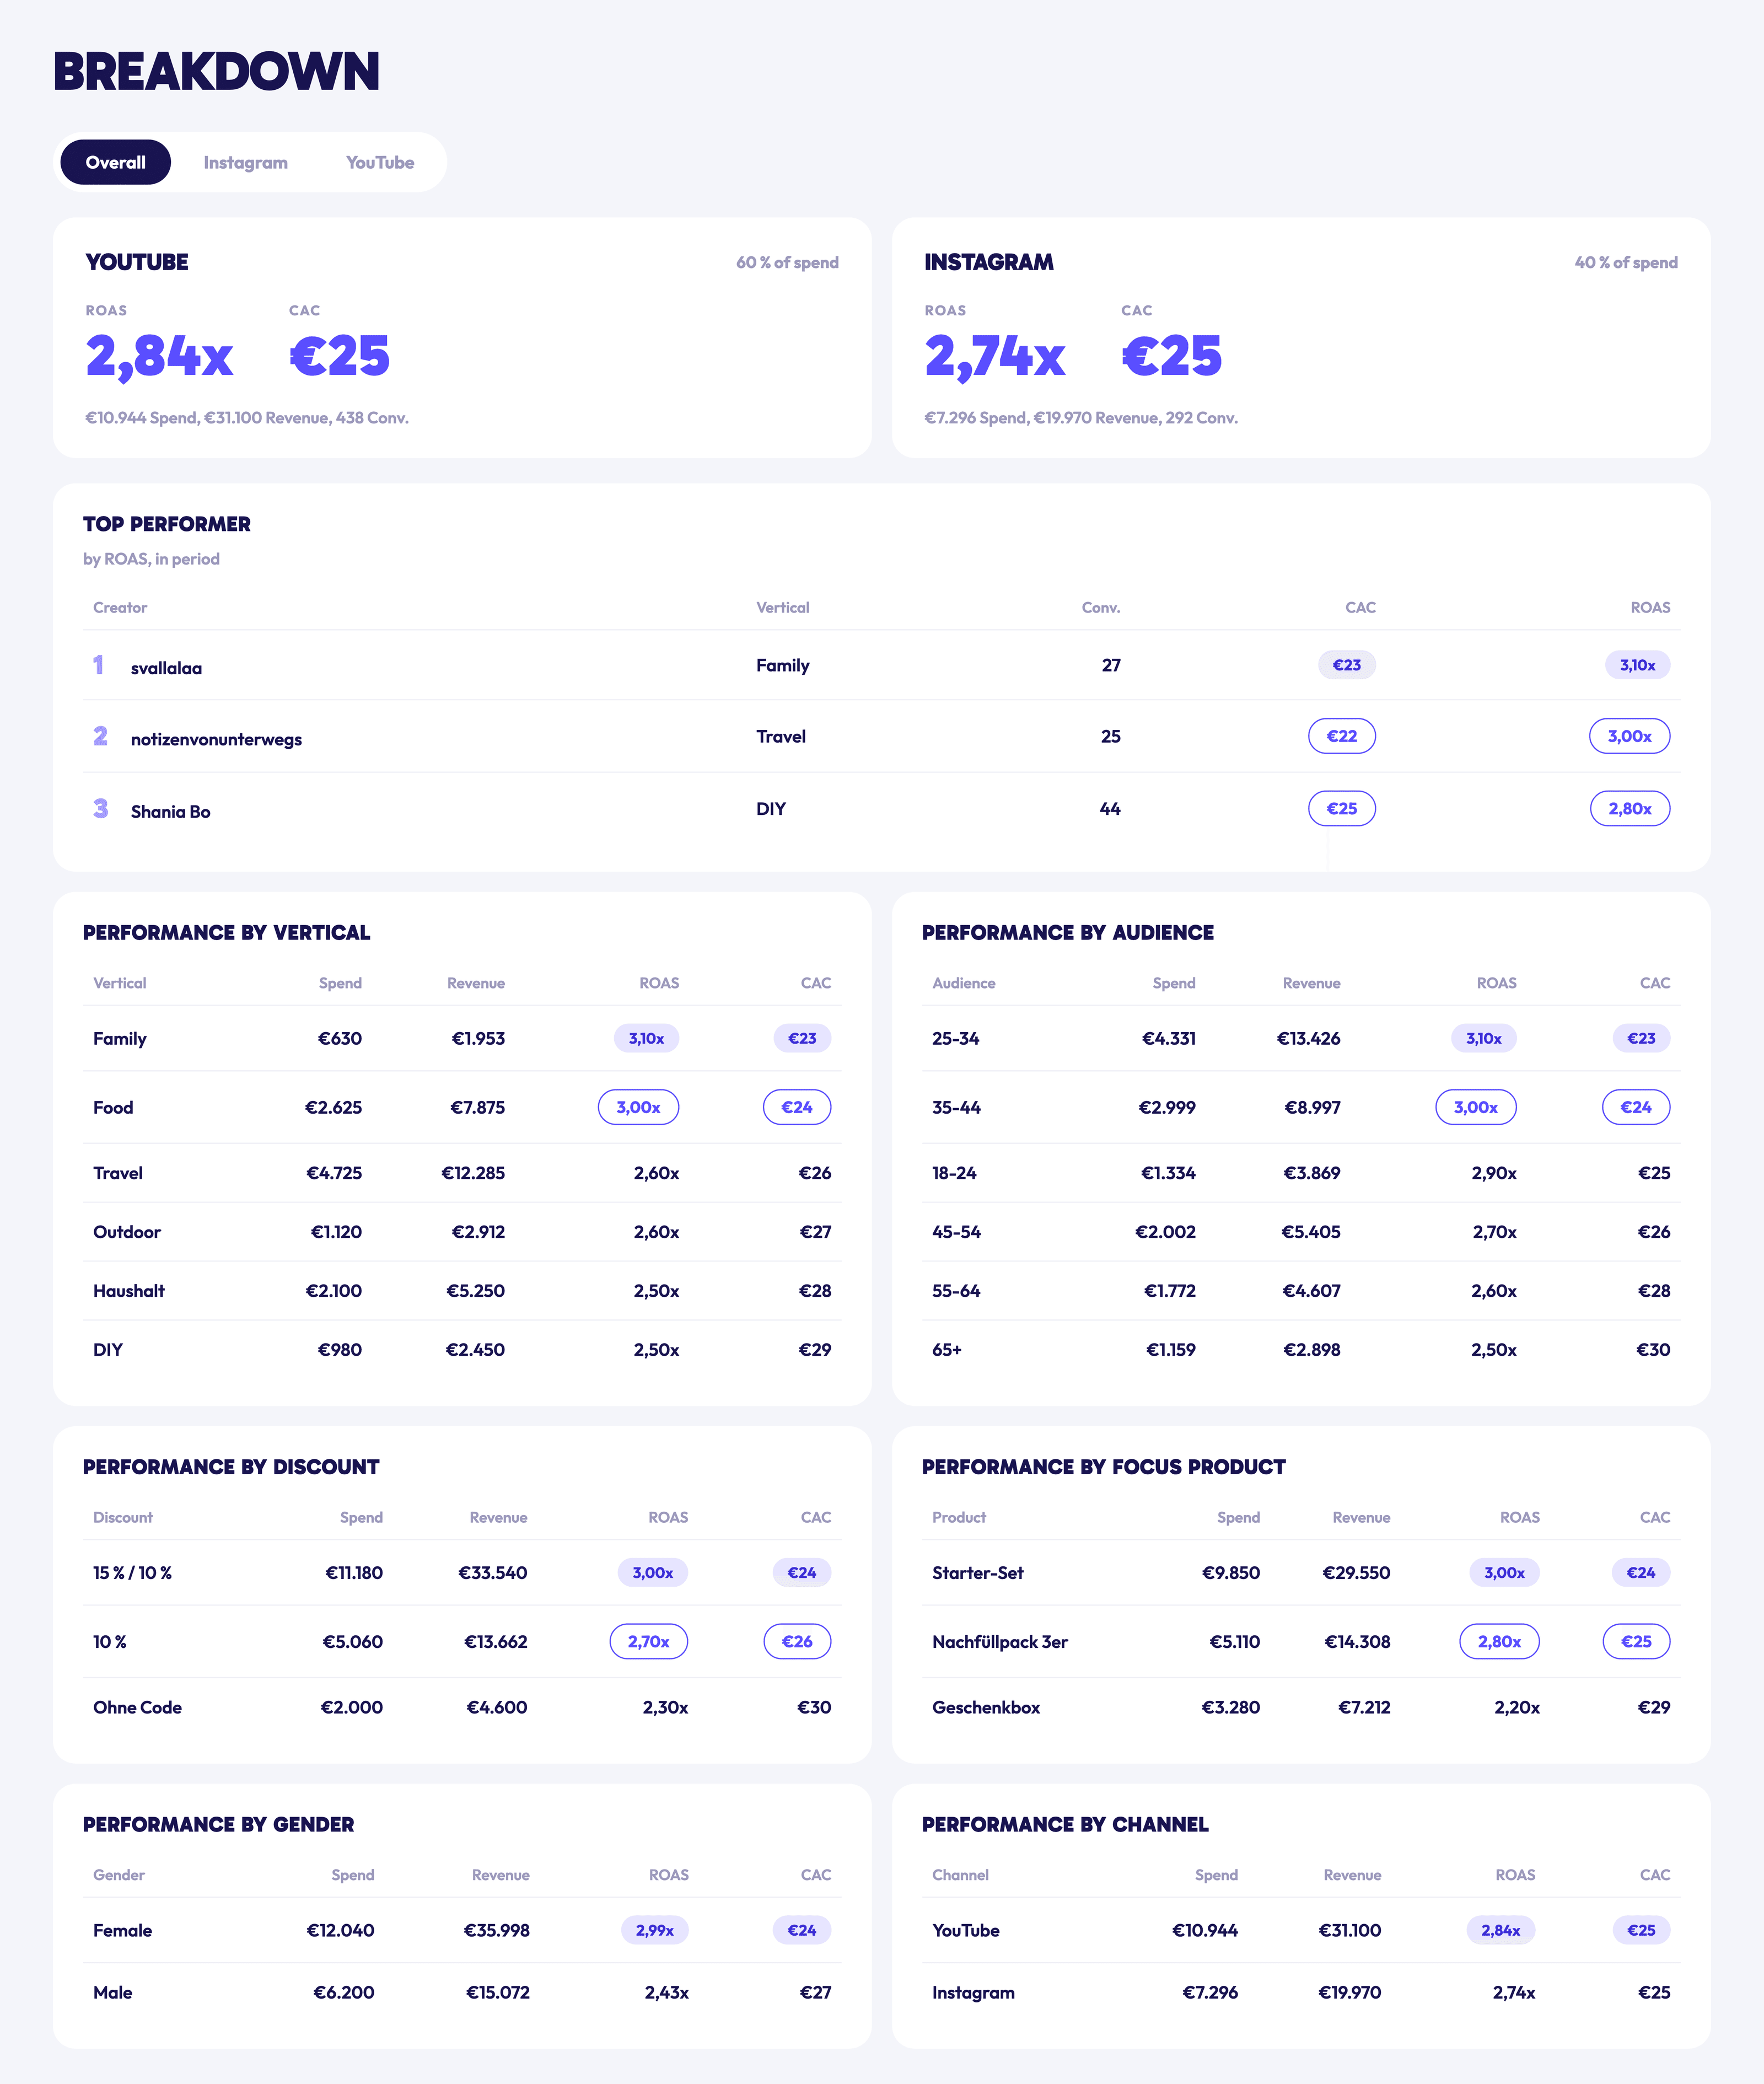
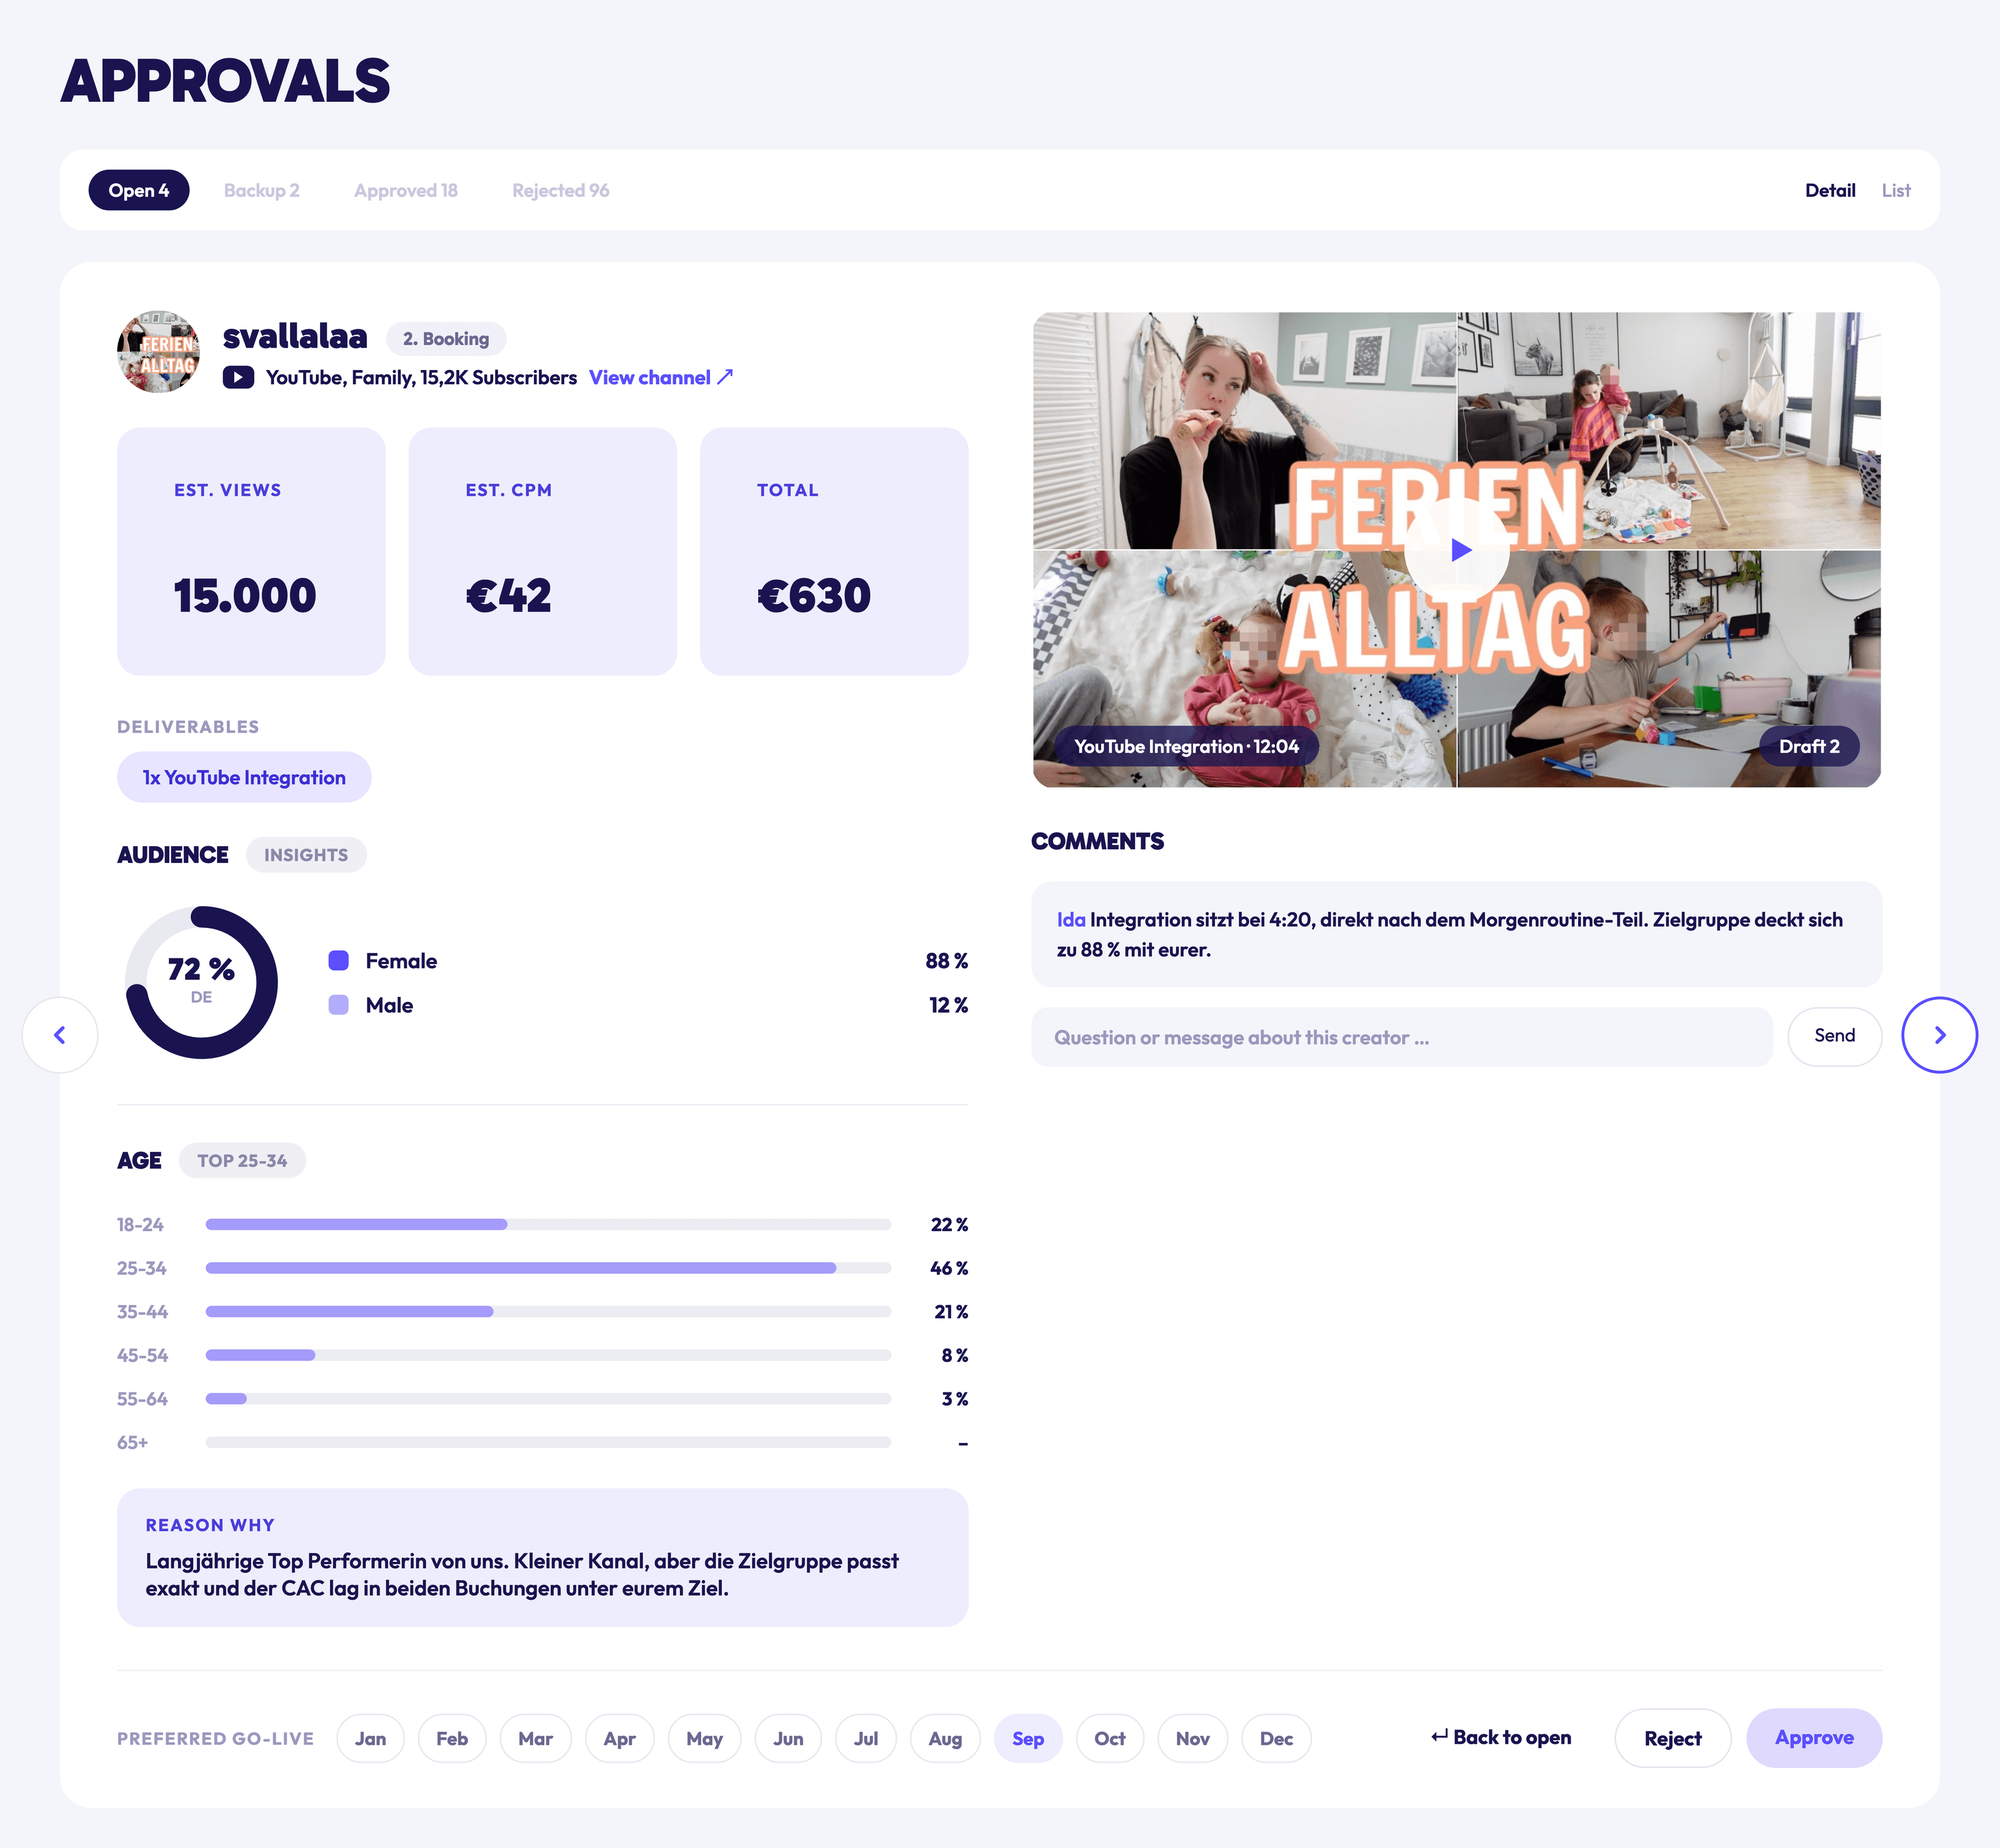
Budget goes to proven performers. IDA compares creators directly, showing who sells and who only brings reach. We rebook top performers, and every new proposal includes expected views, effective CPM and total costs upfront.
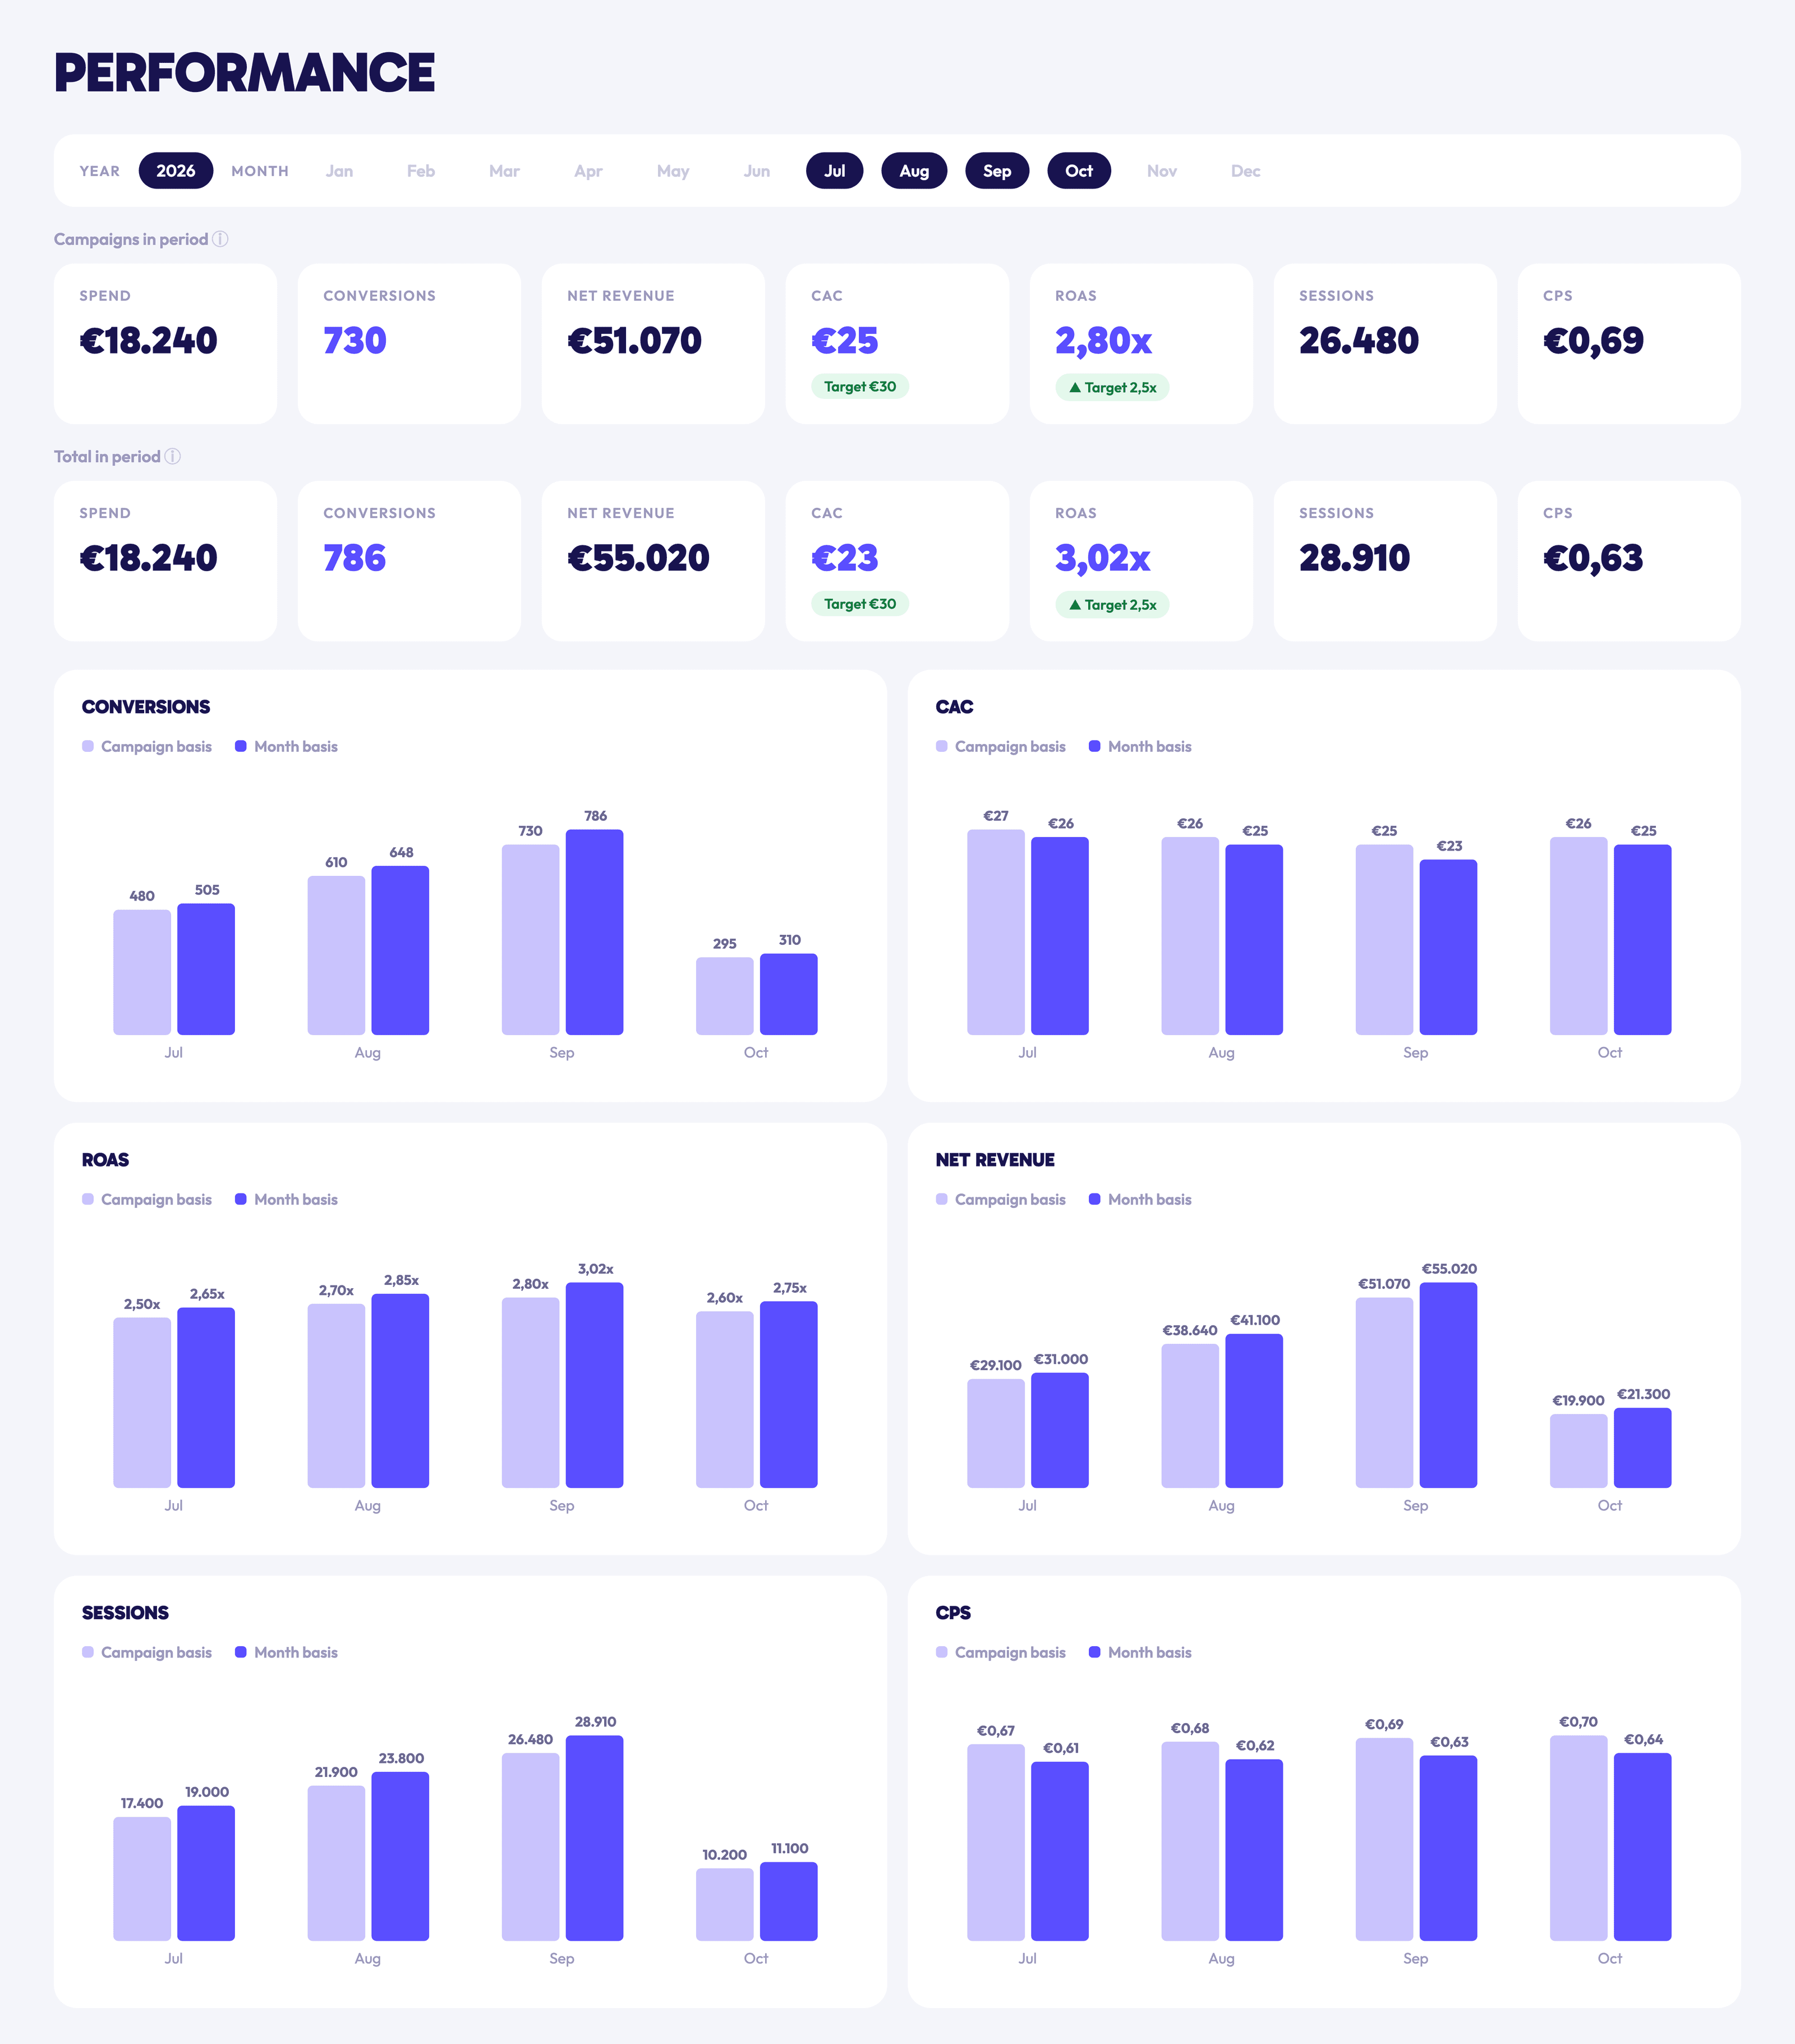
Each month, spend, conversions, net revenue, new-customer costs and ROAS sit alongside your targets. You can make the case for more budget with a report, rather than asking for trust.
End the influencer tool chaosMake IDA your single source of truth
IDA brings your data together, updated daily. Every booking recommendation we make is backed by evidence—giving you a solid foundation for profitable, scalable influencer marketing.
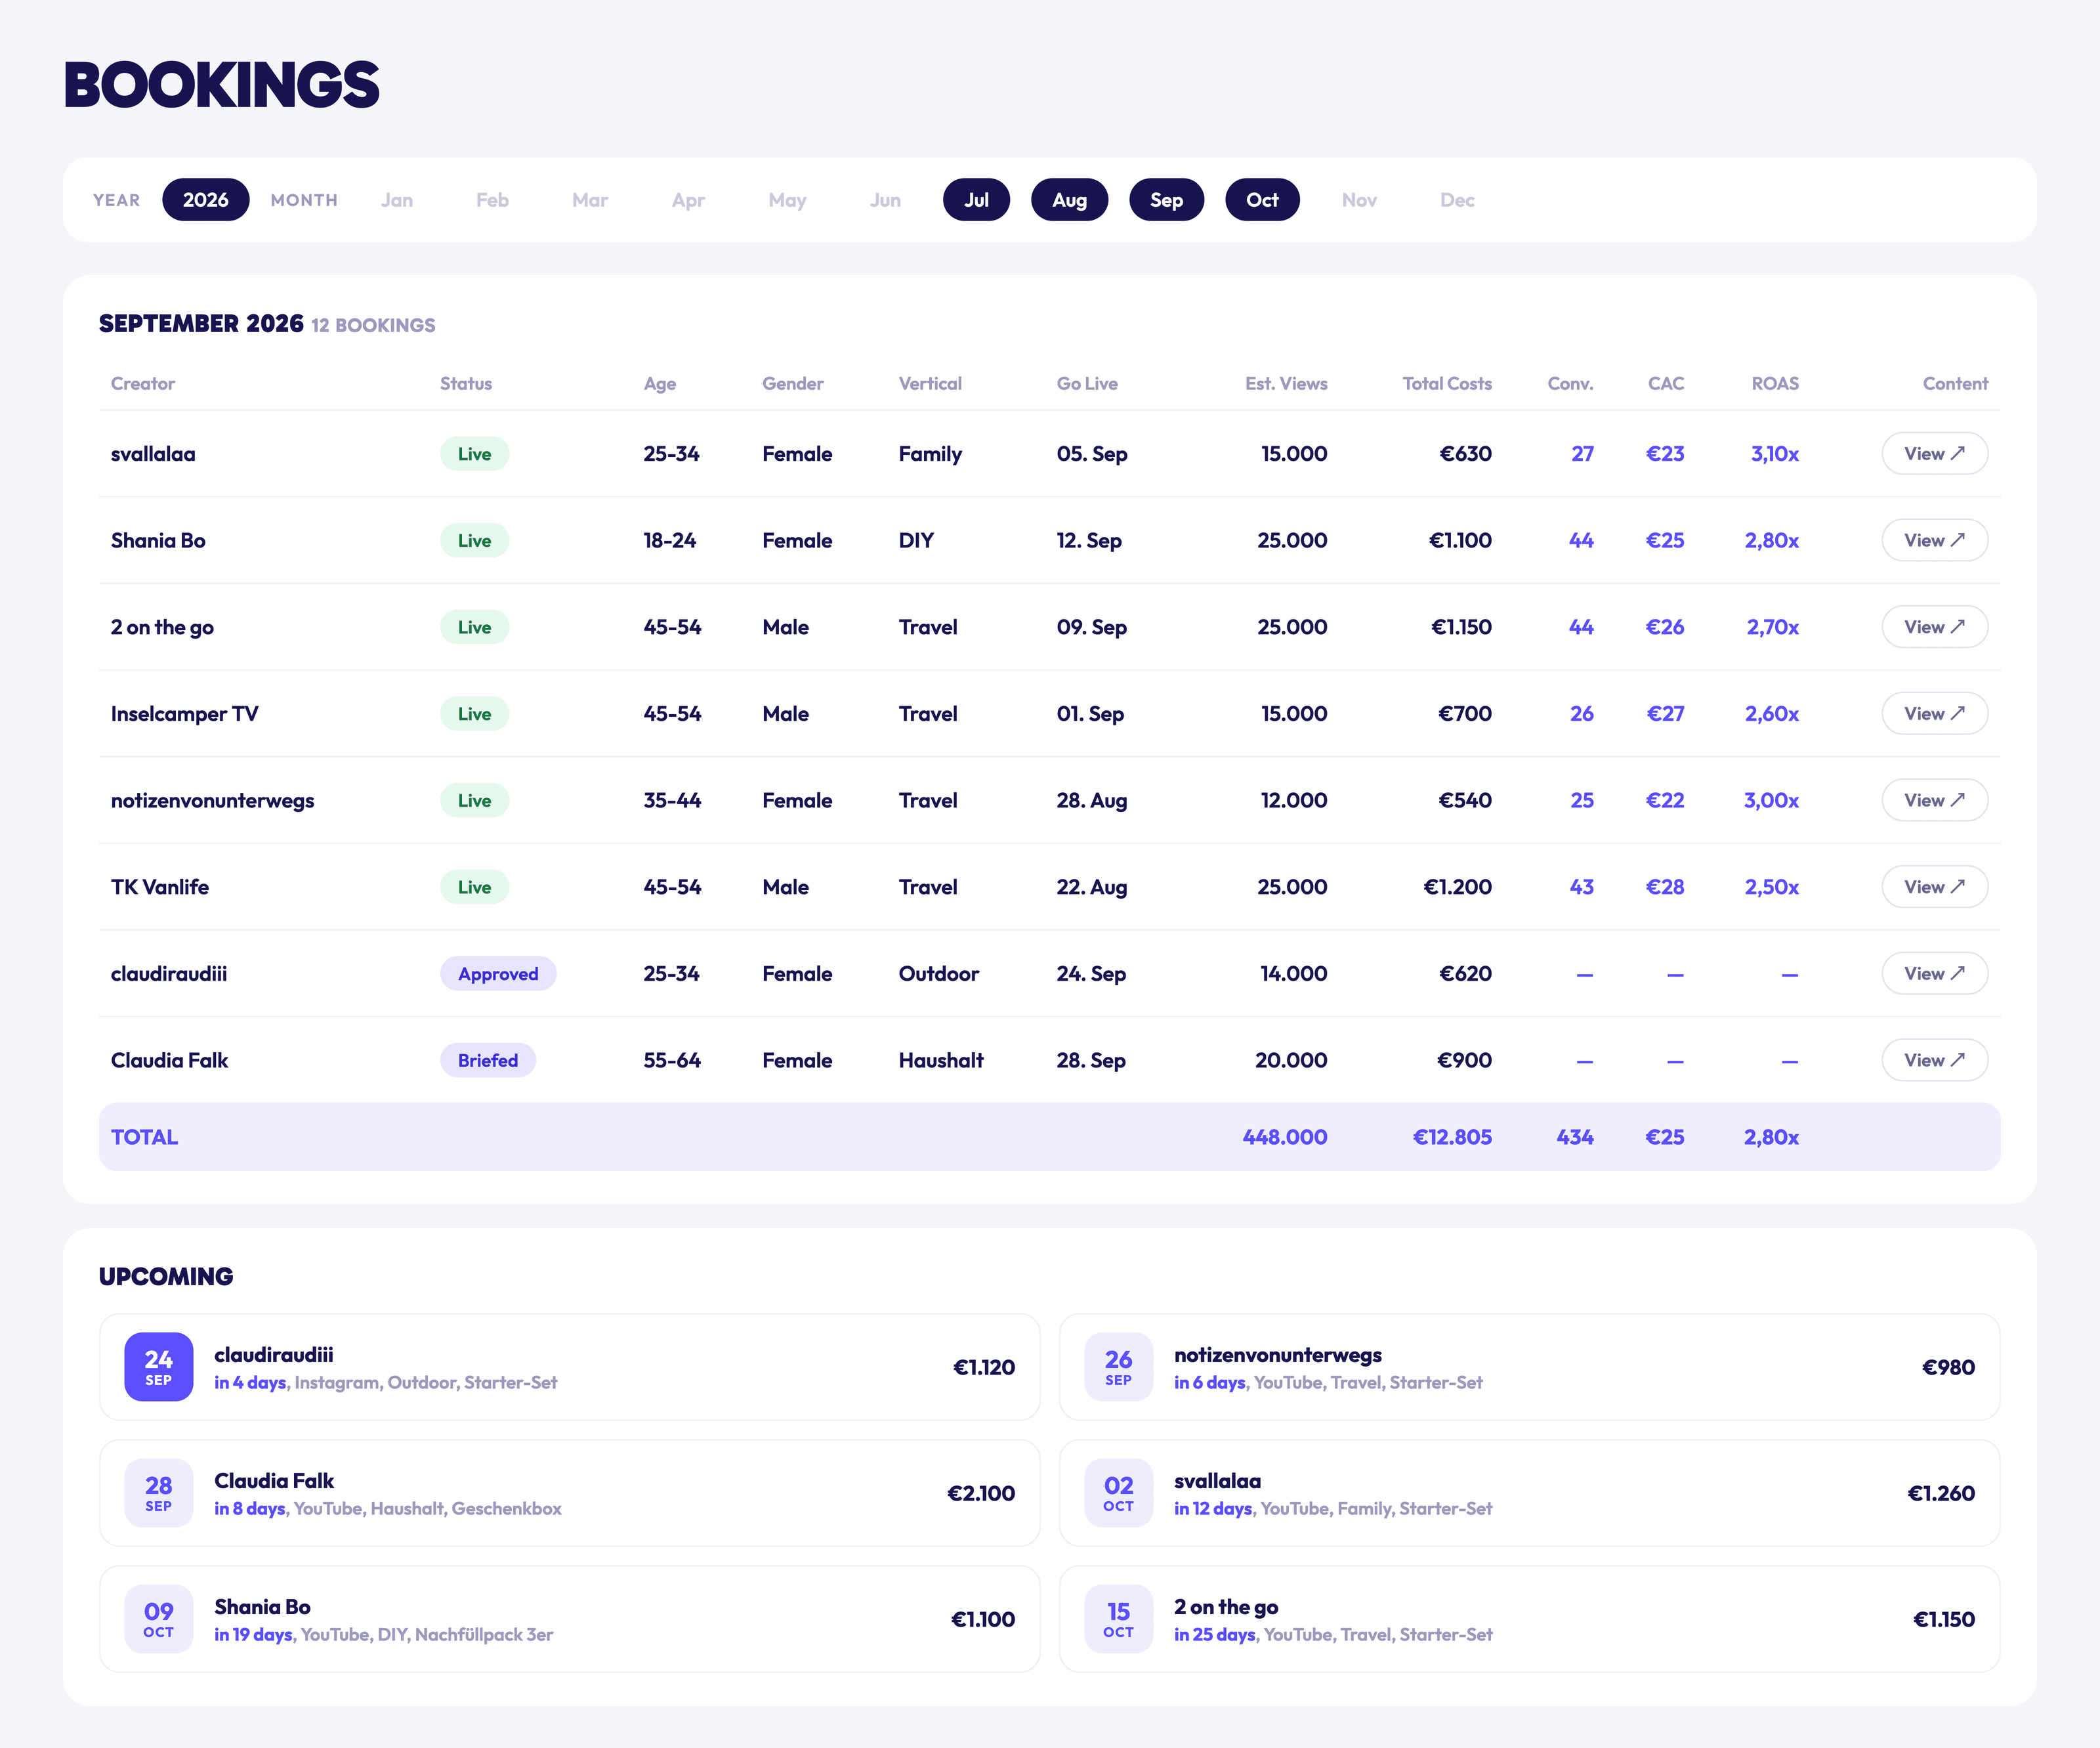
Every campaign at a glance
See every booked campaign: creator, status, audience, vertical, launch date, expected views and cost. Once it goes live, conversions, CAC and ROAS appear in the same row.

Want to know which creatorsactually drive sales?
- 50 minutes
- Analysis & strategy
- Investment & outcomes





300+ stores successfully scaled
by turning creators into a reliable acquisition channel
What you presentto management and finance
This is what a report from us looks like: every booking with cost, CAC and ROAS, the result against your target and a clear recommendation at the end. Click through the twelve chapters.
What every report contains
01OverviewCost, views, orders, revenue, CAC and ROAS
- €18,240Spend
- €51,802Revenue
- €25CAC
- 2.84xROAS
Sample data from the IDA demo. Every monthly report from us follows this structure.
More about IDADon’t just ask usAsk our clients
As featured in





Tracking and attribution questionsStraight answers
Each creator has a unique UTM link as well as a code, and Google Analytics shows what that traffic does on your landing pages. Links and analytics don't capture every purchase: according to Bitkom, 21% of internet users in Germany reject all cookies. Where codes and links fall short, we also use an attribution model that includes repeat purchases.
No, IDA works alongside them. The KLAR integration keeps your creator data up to date there too, without extra manual maintenance. You can compare creator results with your existing attribution.
We can spot this in IDA because codes are synced with your store and unusual redemption patterns stand out. Those orders could distort a creator's results, so we don't judge performance on code revenue alone.
Codes, UTM links and IDA are set up before the first placement goes live. You see daily results from launch. Because orders continue to come in, we assess placements over time. The first top performers typically emerge within the first three months.
The same metrics you use for Meta and Google: new-customer costs, ROAS and net revenue, compared with your targets each month. Plus planned versus actual spend by platform. You have your own IDA access and see the same numbers we do.
No time for a call?Tell us a little about your business
Tell us what you sell, where you are today and what you want to achieve with creators. We will review your store and email you an initial assessment.
- No meeting required
- Initial assessment by email
- A reply within 24 hours